History 390 Final Project

The First Punic War (264 to 241 BC) ended with a Carthaginian defeat, leaving the Roman Republic not only the major power in Europe, but across the entire Mediterranean.  Carthage was battered and broken, militarily and financially, with Rome adding insult to injury by imposing crippling treaty agreements, trade penalties, and military sanctions.  Not unlike Germany after WWI, Carthage became bitter in its defeat, rebuilding itself with the hopes of revenge against the unfair extent of Rome’s victory.

The Second Punic War (218 to 201 BC) was the Carthaginians’ response to Rome’s perceived power over the Mediterranean.  In the decades since their defeat, Carthage had been preparing armies and funds to help fight the Romans another time.  Leading them would be one of the greatest strategic military minds in history; Hannibal.  Son of a Carthaginian general who served in the First Punic War, Hannibal grew up having a strong hatred for Rome and vowed to take revenge on what they had done to his people.  When the time came for war, Hannibal daringly lead his armies across the Mediterranean Sea and up over the Alps which stood in his way a Italy and the heart of Roman Republic.Hannibal's Invasion Route

The Battle of Cannae took place on August 2nd, 216 BC near the town of Cannae, roughly 150 miles from Rome.  Hannibal had delivered crushing defeats to the Romans earlier at Trebia and Trasimene, which had demoralized the Roman army and caused the command over the legions to change 3 times.  The Carthaginian army was becoming increasingly outnumbered by their Roman enemies, yet had routed them in every battle that had been fought so far.  Coming off his victories, Hannibal captured a large supply depot in Cannae, cutting off the Roman supply lines and forcing them to take action against him.

Tiberius Sempronius Longus and Gaius Flaminius, each generals of the Roman army had failed to stop Hannibal’s advance into Italy.  The Roman Consul appointed Gaius Terentius Varro and Lucius Aemilius Paullus to retake Cannae before their supply lines were completely destroyed.  Marching to Cannae with a force of 86400 soldiers and cavalry, Varro and Paullus were confident in their ability to defeat Hannibal’s smaller force of 50000 Carthaginians.  Varro, the senior commanded, was known to be rash, hot-headed, and had a strong hatred for Hannibal.  Despite Hannibal’s perfect track record against the Romans, Varro was certain he would be the one to defeat him, and his large force only increased his hubris.

The first skirmish of the battle occurred outside Cannae, as the Romans were approaching the town.  Hannibal had sent a small force to ambush the legionnaires, but they were pushed back and did nothing to deter the Romans.  This move however, might be what won Hannibal the battle.  By defeating the Carthaginian ambush, Varro and the Roman soldiers gained a large amount of morale and confidence; and for Varro, overconfidence.  For the rest of the engagements that happened during the battle, Varro would act recklessly, unstrategically, and underestimate the abilities of Hannibal.  Paullus was nervous about further engagements, but was wary to withdraw after their first victory.  Whether Hannibal was aware he was using the Romans’ strengths against them is unclear, but the strategic significance of the first encounter cannot be understated.

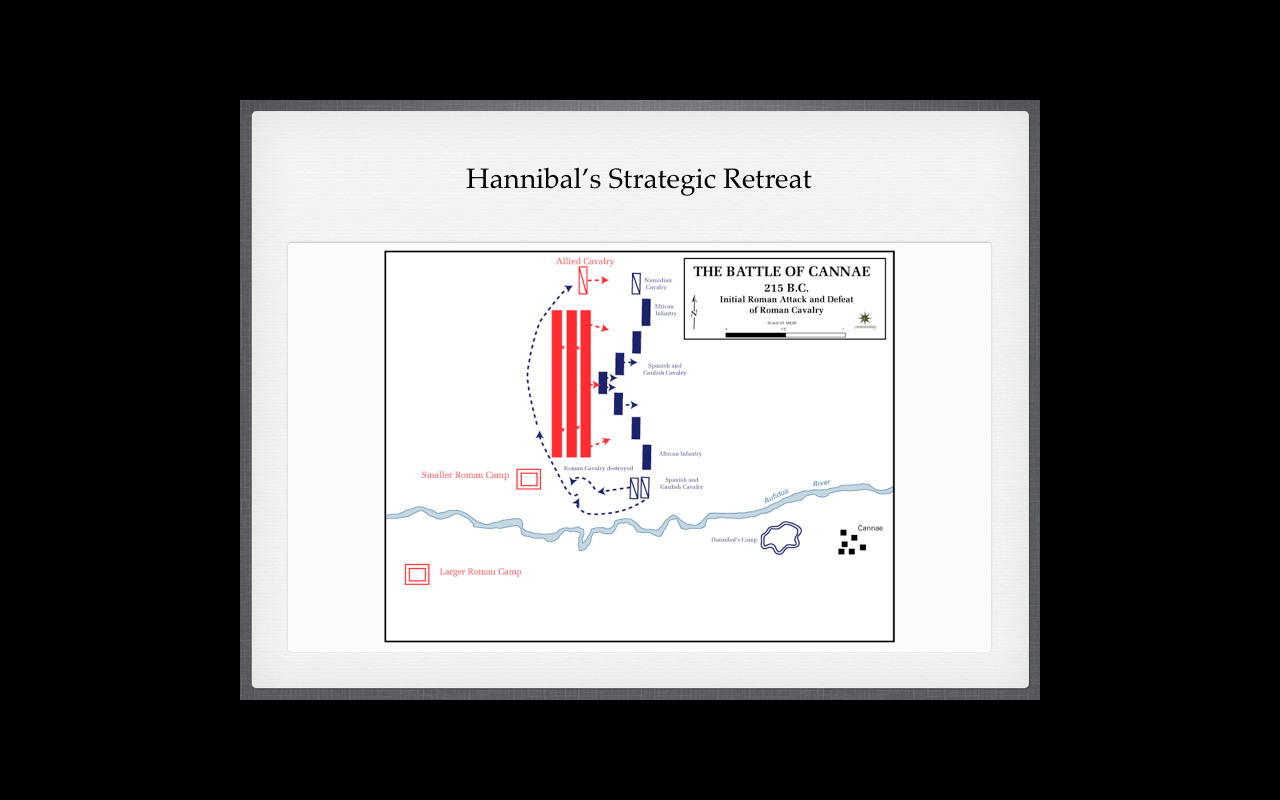
After two days of staying in their respective camps, the armies of Roman and Carthage met in a full battle on the plains of Cannae.  Both armies marched forward in line formation, and as they neared each other, Hannibal stretched out his battle line.  The cavalry met parallel to the foot soldiers, with the Carthaginians actually outnumbering their Roman counterparts.  For the first phase of the battle, everything proceeded normally, everything going according to Varro’s plan of overcoming Hannibal with superior numbers.The Battle of Cannae Phase 1

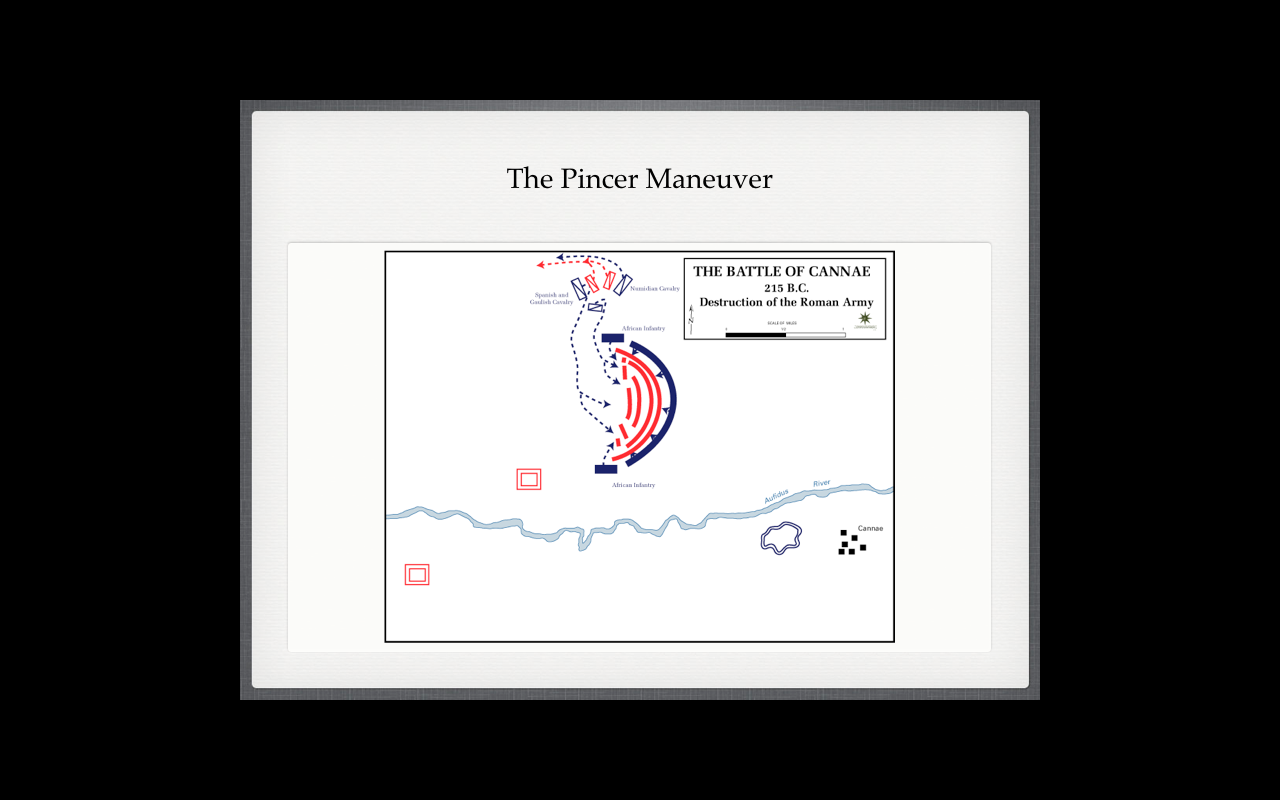
What happened next was all according to Hannibal’s plan though.  With his front lines thinned an his battle line longer than the Romans’, Hannibal soon ordered a retreat to his center line, while keeping his flanks advancing.  Varro, perceiving his enemy’s front line collapsing, had his troops charge forward, continuing to push back the Carthaginians.  After a good deal of retreating, Hannibal stopped his forces, stalling the Roman advance as they crowded towards their front.  his allowed for Hannibal’s flanks to sweep inward, creating a semi-circle around the Roman army.  The Roman infantry had advance so far that most of their inner lines were unable to see or move freely.  Most soldier could not wield their spears they were in such crowded conditions, or draw their swords.  The Carthaginians had trapped the Romans in their own mass; their superior numbers meaningless in such a situation.The Battle of Cannae Phase 2

The cavalry battle was even more of a Carthaginians victory.  Their numbers outweighed the Romans’, yet their skill gave them an even greater advantage.  Hannibal’s Hispanic and Gallic horsemen were known to be some of the best cavalry in military history, and they annihilated the conservative, inexperienced Roman cavalry.  After many cavalry battles had ended, it was normal, almost guaranteed that the victors would ride their horses into the enemy camp, which was presumably unguarded, and loot it; taking treasures, weapons, slaves, and supplies.  Hannibal however, wanted to make the most of his advantages, and told his cavalry that after they defeated the Romans, to attack the infantry from behind, completing the circle and surrounding the enemy entirely.

With the cavalry now in the fray, Hannibal had his flanks, consisting of battle-hardened African troops, to turn and march inward.  With Hannibal and the Carthaginian infantry at their front, African infantry at their sides, and Gallic cavalry at their rear, the Romans were now encircled in a ring of death.  Hannibal successfully executed the first pincer maneuver in military history.  The following fighting can only be described as a massacre.  The Romans, so packed together, could barely move, much less use their weapons.  The Carthaginian army systematically cut down thousands of Roman soldiers, many dying from suffocation as their fellow legionnaires fell on them, crushing them as they tried to dig holes in the ground for air.  The killing lasted eight hours, until the night ended the battle.

The Battle of Cannae saw the greatest number of Roman casualties up to that point.  If fact, only the Battle of Arausio a hundred years later has a higher casualty count, meaning Cannae is the second largest defeat in Roman history.  Casualties number as low as 45000, while some reports say it could be as high as 80000 deaths.  For perspective, the Carthaginians had to have killed over 600 Romans a minute for consistency to the lowest figure.  Their loss was so great and taken so negatively by the public, that many of the Southern regions of Italy defected from the Roman Republic and joined Hannibal’s cause. Varro was never put in command of a Roman legion again, and Paullus died in the battle.  Many of the most excepted figures of casualties (and information on the battle as a whole), are from Roman historians Polybius and Livy.  Other have written about the battle, but both Polybius and Livy have the most available records and are considered the most accurate details. Battle Of Cannae


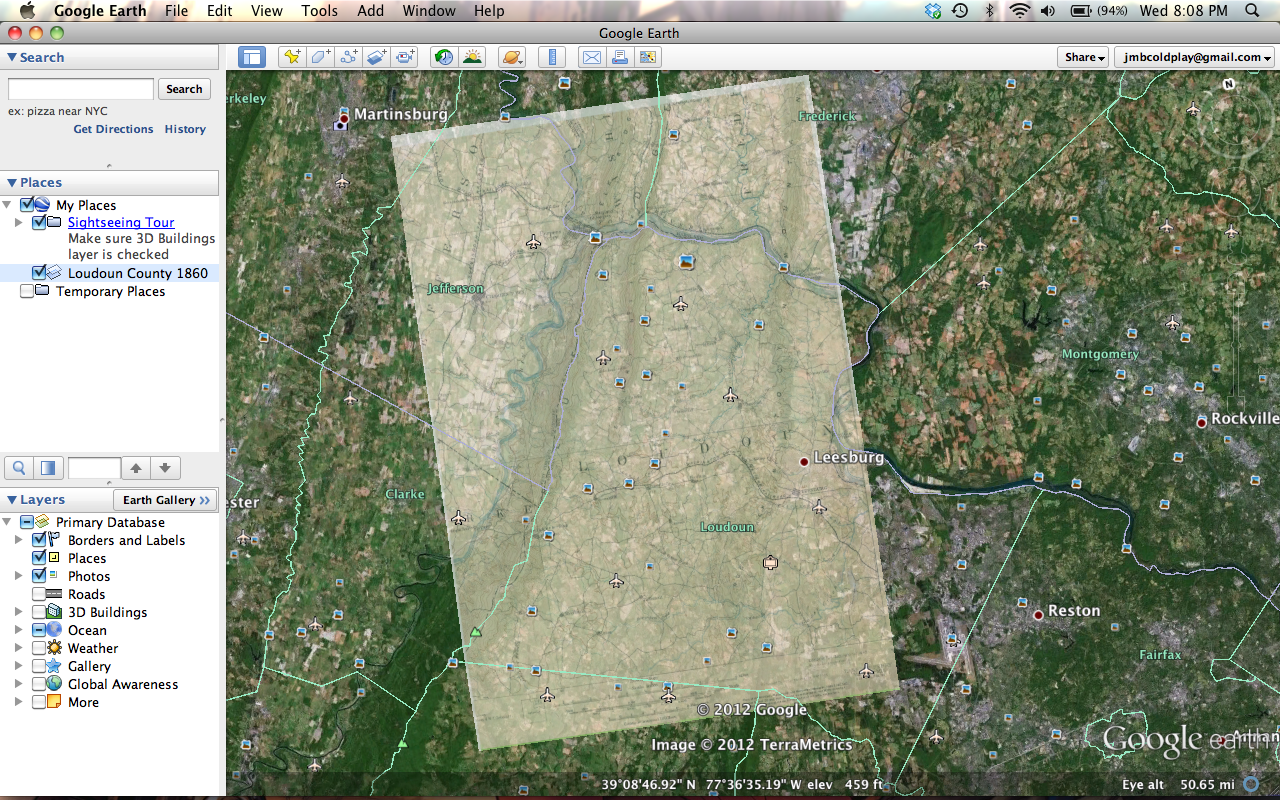
View Hannibal’s Italian Campaign in a larger map.

Wordle: The Battle of Cannae Wordle: The Battle of Cannae (Livy)

These wordles are of Polybius’ (left) and Livy’s (right) writings on the battle.  One difference to notice is the Livy’s records tell a lot more about the political and social aspects surrounding the battle.  Words like ‘citizens,’ ‘dictator,’ and ‘gods’ are absent from Polybius’ writings, whose most-used word is ‘battle.’  Of course both have many uses of ‘Hannibal’ and ‘enemy,’ although Livy was known to sympathize with Hannibal in his works, which makes his strong use of ‘enemy’ strange.

Hannibal is known throughout history as an incredibly military commander.  Many historians see the cause of his victories to be solely his intellect and strategic planning, yet in the Battle of Cannae, I believe that the Romans have as much to with their defeat as Hannibal does.  The first conflict, with the Carthaginian ambush gave Varro and the Roman soldiers too much confidence going into the battle.  Rome as a whole had never won a battle against Hannibal, and even being able to deter a small surprise attack would give then false hope in Hannibal’s true abilities.  Records and accounts from that time tell us that Varro was reckless and rash.  He was of low birth status, and Livy says that he wasn’t well liked by his fellow Consul members.  This gives Varro a reason to desire victory as proof of his position and respect of his piers, and why he might have been so ready to defeat Hannibal; throwing his troops up the center of the battle line without concern.  Paullus can also be blamed for their failure, as he was in command of the flanks during the battle.  While he is considered to be the more level-headed and controlled Roman general, the fact that he let the Carthaginian flanks surround him in such a manner sheds light on his military prowess (or lack thereof).  In the end, Varro’s nonexistent tactics and Paullus’ inability to effectively command his troops is just as devastating to the Roman army as Hannibal and the Carthaginians.  If Varro had exercised caution and not run headlong into Hannibal’s center, the pincer maneuver would have failed, and the Romans would have been in a much better position even with their cavalry defeated.  The Battle of Cannae shows how military advantages can quickly turn into disadvantages if control and intelligence are replaced with stupidity and recklessness.

_____________

Sources:

http://www.fordham.edu/halsall/ancient/polybius-cannae.asp

http://mcadams.posc.mu.edu/txt/ah/livy/livy22.html


Aimless, Random Wanderings

For my blockly maze solution, I wanted to find the smallest, most compact phrase to get him to the end of the maze.  With that in mind, I knew I couldn’t rely on step-by-step commands, such as a long list of ‘Move Forwad’s and ‘Turn Right’s.  And also, not being a programming genius or a logic expert, decided to go with something simple, and almost stupid.

My phrase is ‘Move Forward’ and ‘Turn Randomly,’ and repeat until finished.   It seems silly I know, and the first time I ran the program it took nearly 15 minutes to complete it.  But it does work, and I definitely is one of the shortest programs I’ve seen.  It might be be the most effective of fastest method, but it got the job done for me and didn’t require as deep of thought or time setting the program up as some of the more complex ones do.  Although it is mostly based on luck, which I doubt would get me very far in the programming world, it was fun to watch the little guy wander aimlessly around the maze, cheering him in the right direction as he hopefully turned down the right path.

Thoughts On Digital Archives

With the ever increasing tide of technology, archives of all kinds are starting to be digitally stored.  And with ease of access and near unlimited space, why not?  The pros of digital archiving are very apparent, which causes the cons to be overshadowed, leading many to think there are none.  Yet the problems are just as real as the benefits, and great care has to be taken when turning physical records into their digital counterparts.

Looking at The Roy Rosenzweig Center For History And New Media, I found a number of articles about the importance of digital history, and the dangers that it could produce.  One article, written by Daniel Cohen (my awesome History 390 professor), states the concerns he has with digital archiving.  With more recourses being available online, a kind of rich-get-richer and poor-get-poorer aspect comes into play, with those with sufficient technologies benefitting greatly, but other who lack them falling further behind.  Also, new technologies are constantly being improved and replaced, and it’s unknown how long it will be before our current technologies are outdated.  VHS, hard disks, and cassettes have come and gone in the space of 30 years or so, and all the information on then if lost forever or at the most very hard to get ahold of.  Could that happen other 30 years from now, and all the archives, databases and information we have online be completely inaccessible?

Digital archives do have their positives though.  For one, a majority of the world can access them over the Internet; such as a Northern Virginian teenager going deep into the streets of Ancient Rome, or viewing priceless artifacts only on display in a London museum.  I’m talking from experience here.  Digital archives can be vastly large, and hold more information and records than any physical database could ever hope to contain.  And there’s the social affect of having everything online.  Much more interacts can be made with all types of people, giving new insights, allowing other to learn more, and maybe sparking a flame in someone to pursue history in a more in depth way.

For the good that a digital database can entail, more should be done to combat the negatives.  keeping an eye on new technologies to ensure archives don’t become obsolete is crucial, and making an effort in provide more people with up-to-date access to them will make the social aspect of the digital archive thrive.

Swearing By Ngram

The Google Ngram is an astonishing piece of work.  By searching Google Books, which has over 20 million books in it’s library so far, the Ngram finds any word you want to look for and shows how frequent its use has been over a varying timespan.  Given as a percentage, you can see what number of the total words written in a certain era is your word.  My time with Ngram was used to see the evolution of the use of curse words.  There will be some colorful language in this post, but I’ve always been interesting in how the use of them has changed over time.  For these words, I’ll be looking solely in the English corpus of Ngram, from 1600 to 2008.

The first bad word I looked into was ‘damn.’  I noticed this trend in pretty much every word I search, and that is that during the 1800s there is a drop in usage for curse words.  Maybe this was because of the refined era, between, the more loose social bearings on the 17th and 18th centuries, and the freedom of the 20th century.  As you can see, use of damn was relatively high in the 1600s, and reached its highest point in 2007, and has probably continued upward over the past 5 years.

Here you can see the use of ‘hell’ in written works.  Unlike most of the words I looked up, hell peaks very early, and never really comes back into usage, or at least with the prominence it once had.  Of course, this is probably because of the religious text from the earlier centuries; talking about actual Hell and not as an expletive.  That is one of the complaints I have about Ngram, that words with multiple meanings and connotations can’t be looked up separately, meaning you don’t know which usage of the word is being used.  Although I can guess with fair certainty that many of those 17th century uses of hell are religious-based.

‘Ass,’ like hell suffers from the problem of not knowing which meaning is being used in these writings.  Just knowing how language evolves, I can guess that the earlier uses of ass are speaking of the animal, while later uses, such as how it rapidly increases beginning in the 21st century, are talking about the butt or calling other people asses.  Again, there is a decrease in use during the 19th century, probably due to high society, but not nearly as much as some of the other words.

‘Shit’ is probably the funniest graph I was able to find.  Virtually no use from 1780 to 1940, and then a huge spike, and is probably still increasing.  There are also small instances of it being used as far back as 1640, but these fizzle out quickly.  It’s strange to thing of any of these words as modern, but shit fits that definition quite well.

Contrasting shit in it’s timely usage, ‘fuck’ was huge in the 17th and 18th centuries, but never got back to its height of usage after.  Fuck also exemplifies how the 1800s and early 1900s were a no-go area for curse words, with extremely low instances of it being used in those times.  As a Shakespearian word, it’s not hard to image it being used with such prominence during and shortly after his life, but the fact that it never came back into large usage, even in the 21st century, is a little surprising to me.

Comparatively, hell has by far the most usage out of all these curse words, outnumbering all the others combined when at it’s height in the 17th century.  Other’s like shit are just starting to appear and make it into our literature.  While we would consider own time to be one of foul language and swearing, its weird to see that at least as far bak as the 1600s people used many curse words far more frequently than we do today.  Of course, this is just there appearance in writing, but literature more often than not is a good indication of the time, and I’m happy to say that we’re not the most dirty-mouthed generation, something I wouldn’t have believed if you’d told me before today.

My Keynote Slideshow

First off, I’ve taken a long time to post this because, as I’ve said in my previous post, I’ve never used any kind of PowerPoint/presentation software in my life.  I’ve always had Keynote on my Mac, but this is the first time I’ve even opened the application.  To that end, it took me forever to find out how to get the slides on here.  In fact, I still don’t know how to, and have resorted to taking screenshots of them and pasting them up here.  I have no idea how (or if) you can post the actual slides or the presentation on a blog, as I’ve tried to do so about 100 times.  Anyway, here is my presentation.

My slideshow is on the Battle Of Cannae.  I really feel that one of the things that make PowerPoint so maligned is that it’s boring, repetitive, and most people just read found them like a textbook when presenting.  That’s why for my slideshow, I made there as little text as possible.  If I was doing a presentation with this slideshow, I’d speak from notes or what I’d have memorized about the battle, instead of putting everything on the slides.  For my first slide, I have the title of my presentation, with some subtext, and a picture of Hannibal.  Very basic and easy to understand; I’m only trying to get the subject out there.  I don’t want to bog my audience down with words and having to read paragraphs.  Short and simple.

For my second slide, I have a simple picture of the Roman’s and Carthaginian’s battle movements and formations.  In particular, it shows the beginnings of the Roman’s defeat, as Hannibal starts his frontline retreat.  This caused the Romans to push forward up the center, leaving there flanks open from Hannibal’s African troops to close them in.  It also shows the defeat of the Roman cavalry, which ends up adding more insult to injury in the next stage of the battle.

In the final slide, the Roman’s defeat is show in full effect, with Hannibal’s maneuver completed.  What is now known as the pincer maneuver, this is earliest instance of it ever being used, and had devastating consequences for the Romans.  As the Roman center pushed forward faster than its flanks, the Carthaginians surrounded them in a crescent, while Hannibal stopped his center’s retreat, effectively capturing the Romans in a deadly semicircle.  In most ancient battles, the cavalry would simple sweep through the enemy once, and then go and raid there camp, which was usually empty during the battle.  The Carthaginian cavalry though, instead of ransacking the Roman camp, came back around, charging the Romans from behind, and attacking there weak point for massive damage.  The Roman’s, helpless and trapped inside a wall of Carthaginians, suffering major loses, with over half their force being killed, and that’s when looking at the smallest recorded casualty listings.

I don’t know if this kinda of meta-analysis of my slideshow is what I should be doing, but I think it works.  Looking at my slides, I used them more for things I couldn’t do, such as draw a map of the battle (I mean, I could, but it would be very time-consuming), instead of boring people to death with words and bullet points.

PowerPoint, My Mortal Enemy

I’ve never liked PowerPoint.  To be honest, I’ve never even used it.  I’ve never been in a situation that needed a slideshow presentation, which I’m thankful for because I despise them.  I find them boring, lazy, unimpressive, and unimaginative.  Of course, there are always exceptions to this, as some slides I’ve seen from my professors have been well done, but the vast majority aren’t.  Edward Tufte expresses these concerns in his article on the evils of PowerPoint, saying that the presence of PowerPoint and slideshows in schools is for the worst.

I of course agree with him; slideshows and PowerPoint shouldn’t belong anywhere, especially in educational environments.  For teachers and students alike, these presentations are a half-assed cop-out for actual lectures and assignments.  The line between bad PowerPoint and worse PowerPoint is thin, with having too much and too little information per slide very hard to overcome.  During some of my classes, the professor will literally recite the slides verbatim, making me wonder why I’m even attending class and not just reading the slide files off BlackBoard.  Other times, the slides will be so filled with words and dots and images that I don’t know what to focus on, which makes taking notes difficult.  And then there’s the student presentations that rely wholly on slides.  I’m proud to say that I’ve never used PowerPoint for any of my class assignments, not wishing to put my fellow students through what they’ve put me through; sitting bored out of my mine as someone stands at the front of the class reading off his computer screen a long-winded slide that I can already see off a projector and have read through numerous times before they finish and repeat for another 20 slides.

There are cases that PowerPoint can be used to good affect.  I don’t think I could have gotten through my Psych 300 class (Statistics In Psychology) without the professor’s equation slides, that were simple and much faster than her writing three line stat equations on the board.  Also, graphs and charts are a lot easier to put onto a slide than hand drawing them, so in an astronomy or geology class I can see how a PowerPoint presentation could be useful and effective.  Still, I dislike PowerPoint with a passion, and feel that many people have fallen into a habit of using it out of ease and simplicity, where other more traditional methods of presenting and teaching would be must more welcomed and effective.

A Graph Of History

For my chart, I used casualty figures recorded from the Battle Of Cannae.  The battle took place in the year 216 BC, between the Romans and the Carthaginians, during the Second Punic War.  The battle is famous for being the first recorded usage of the pincer maneuver, and also as a crushing defeat for the Roman Army.  Hannibal led his battle-hardened force against a Roman Army nearly twice the size of his own; 50000 Carthaginians and allies versus 86400 Romans and allies.  Meeting at the town of Cannae, Italy, they faced off in what looked to be a Roman victory from the start.

The two sides’ battle lines met, each holding their ground.  The Romans were tightly packed, and their center strong.  Letting that strength become their downfall, Hannibal had his center retreat, causing the Romans to push past his flanks.  This led right into Hannibal’s plan, as now his army formed a crescent around the Romans.  His center stopped their retreat, making the Romans stall, who were now so tightly crowded that many couldn’t draw their swords or swing their spears.  The Carthaginians quickly took the upper hand, slaughtering the Romans as they tightened the semicircle around them.  Hannibal had also wisely used his cavalry, virtually annihilating the Roman horsemen on the other side of the battlefield.

The Romans were crushed, with Hannibal’s forces having strategically bested them.  The massacre took all day, the Carthaginians stopping only when night came.  So many Romans were killed that many died from suffocation under the corpses of their fellow soldiers.  Even looking at the lowest recorded death counts, the Carthaginians had to have killed over 600 Romans a minute, a staggering number.  With Hannibal’s forces only suffering a recorded 8000 casualties, a rout would be more suitable than a victory for the Carthaginians.
Battle Of Cannae
Looking at these records, it’s interesting to see the difference each historian had on the battle. Polybius, who would be the first to record the battle, has an incredible death toll, with nearly 70000 Romans having died. The next two, Livy and Eutropius, had more moderate casualties, with the number of dead and escaped being about even. Modern historians tend to agree with Livy’s statistics over others, although Polybius has the most in depth account and information on the battle.

Turning Life Into Numbers

I’d never heard or seen a Feltron Report before, so as I opened the 2008 Report, I was surprised, impressed, inspired, and amazed.  Nicholas Felton, the creator of the Feltron Reports, was fascinated by charts and data, and one day decided to keep track of his life statistically.  Everyday he’d record what he did, when he did it, how long he did it for, etc. until his entire year was able to be put into numbers.  Music, travel, food, photos, and tons of minute details were apart of his annual reports, which he has been doing since 2006.  All these reports are available online to be viewed by anyone who wants to know everything about his life, or to be amazed by the lengths to which he’ll go to write them.

As I looked at the Feltron Report for 2008, I was immediately drawn to the design of it.  Being a graphic artist of sorts, the Feltron reports are visually stunning, with a lot of care put into the colors, graphs, maps, and charts that are easy to understand and stimulating to look at.  2008 for example is mostly grey, with white and lime green accents that make the data pop out.  The only exception to this is the map/atlas, which seems like a jumbled mess of triangles until you view it up-close.  The 2006 Report is better at this, with his maps of Manhattan being very easy to read with the black dots contrasting great on the yellow background.  However, the 2006 Report does show how far Felton has come in graphic design, with the visual differences between the two years very apparent; 2008 looks a lot more professional and entertaining.

One thing in his reports that caught my eye (2008 especially) is the music section, in which he tracks the number of songs he’s listened to, how many artists he’s played, the number of CDs he’s bought, and even a percentage breakdown of which artists made up his top 10 most played.  As an avid music lover, this part more than any inspired me, and even gave me a few ideas of doing something similar with my music in the coming year.  The amount of dedication it would take (and took Felton) is pretty staggering to just think about though, not to mention actively keeping track of all that data.  And that’s just for music, not even everything else he records.  The amount of work Felton puts into his reports is incredible, and has made viewing statistics interesting and fun, something that’s not easy to do.  It’s weird to think that our lives can be broken down into a few pie charts and maps, and that everything we do can be simplified into a percentage.  The Feltron Reports give light to the fact that our very lives are a science, something that can be dissected and studied; which when going about them, we never even have the thought cross our minds.
Replace Bradford Cox with Coldplay and you'll be pretty close to my own Feltron Report.

Google Earth Overlay

For my overlay, I used an old map of Loudon County dating back to 1860.  The county lines are extremely close to what they are presently, and so is the location of the Potomac River, which is only visibly off on the far right side of the map.  As for downloading and accessing Google Earth, the process took a long time since Google wants you to download Chrome along with Earth, which isn’t something I wanted to do, so I spent a lot of time trying to get around that.  The actual placing of the map onto Earth was easy enough, and even kind of fun lining up the corners and finding the right map to use.

Getting the map into this post was a pain though.  I don’t know how to embed my Google Earth places onto my blog, so instead I had to just take a screenshot and put that in this post.  You can clip on the image to get a bigger (and better) view of it.

Historical Digitalization

In William G. Thomas III and Edward L. Ayers’s article, The Differences Slavery Made, both men look into how slavery effected America before the Civil War, and what part it had in ultimately dividing our nation.  Throughout their work, they use digital sources of information, such as maps to provide evidence to their points.  In their analysis, they examine two counties, Augusta County, VA and Franklin County, PA, and how the two were similar and different during the years leading to the Civil War.

Being in Pennsylvania, Franklin County sided with the North during the war, and Augusta County with the South.  Each was a wealthy and productive county, with Augusta ranking first in Virginia’s value of farms, and Franklin ranking 10th in Pennsylvania.  Each was heavily tied to farming, with both producing a large quantity of wheat and corn, among other goods.  Each was heavily invested in manufacturing as well, with Augusta actually having higher investments in railroads, strange to think of when knowing they would be part of the Confederacy.  And how did Thomas III and Ayers come up with these statistics and knowledge?  By digitalizing documents to better understand them.

Under the Evidence section of their article, a large number of maps, charts, and records can be found, all digitalized for ease of use and access.  Using GIS (Geographical Information System), they were able to make soil maps, and using old census records added residency listings on these maps as well.  Finding trade records and more soil information allowed them to discover what types of agriculture were being grown with each plantation of both counties.  Using census records, correlations can be made between agricultural prosperity and slave-ownership, or how many industrial facilities were using slave labor versus free labor.  By wisely using current technologies, Thomas III and Ayers made an incredibly detailed and interesting study that without digitalization would have been long, boring, and difficult to read and maybe even impossible to create.  I find their use of digitalization amazing, and should be a standard to which all historians hold their work to in this age of technology.